What is a Gantt Chart?
A Gantt Chart is a visual representation tool for scheduling tasks over time, often used in project management.
Detailed Explanation
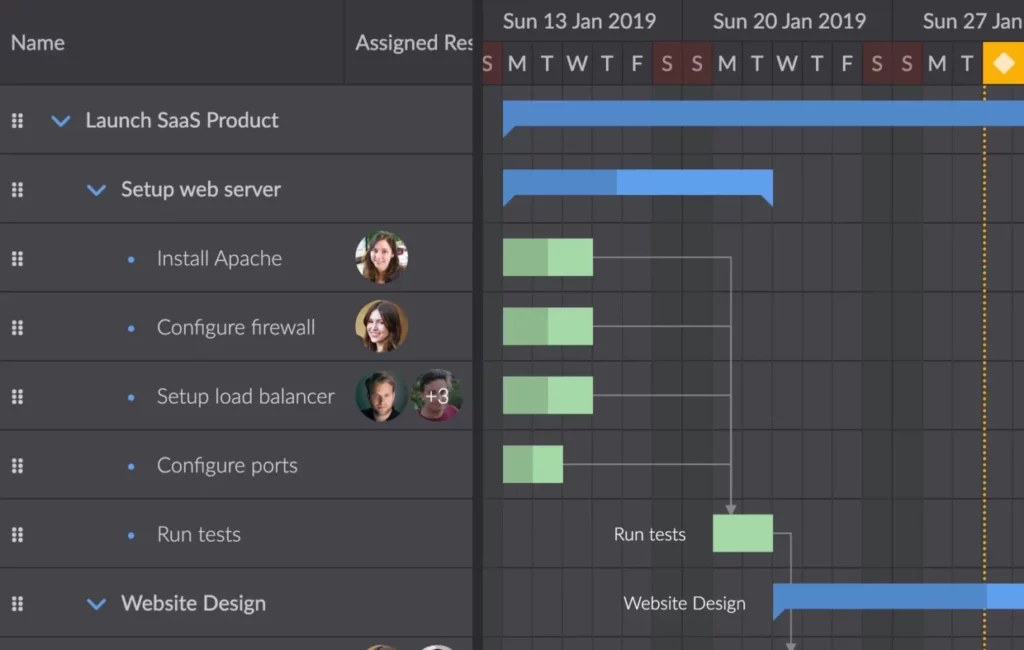
Gantt Charts are graphical representations of a project timeline that visualize the start, end, and duration of tasks, as well as their dependencies. The horizontal axis represents time, while the vertical axis lists the tasks. Bars of different lengths represent each task’s duration.
In a SaaS context, let’s say a team is planning to roll out a new software feature. The Gantt Chart will lay out each step, from brainstorming and design, to coding, testing, and finally, deployment. It allows everyone on the team to see the whole timeline and understand their roles clearly.
Why It Matters
Gantt Charts bring clarity, structure, and visual context to project management, making it easier for SaaS companies to plan, coordinate, and track specific tasks in a project. It provides a clear vision for the SaaS CEO or CMO, helping in decision-making, resource allocation, and identifying potential bottlenecks.
Potential Misunderstandings
Gantt Charts are not detailed action plans. They are strategic tools providing an overview of a project’s timeline and task dependencies. They may not capture the complexity of large projects adequately and are best used in conjunction with other project management tools. They are most effective when used in conjunction with other project management tools, such as the Scrum Agile Framework, Product Roadmap, and Release Planning.
Frequently Asked Questions
Is a Gantt Chart necessary for every project?
No, not all projects require a Gantt Chart. They are most useful for complex projects with multiple tasks and dependencies.
How often should a Gantt Chart be updated?
A Gantt Chart should be updated as frequently as changes occur in the project schedule. It’s a dynamic tool that reflects the current state of the project.